Modern Defense Technology ›› 2023, Vol. 51 ›› Issue (6): 133-145.DOI: 10.3969/j.issn.1009-086x.2023.06.016
• INTEGRATED LOGISTICS SUPPORT TECHNOLOGY • Previous Articles
Shan WANG, Hua ZHANG, Haowen SONG, Xiao CHEN
Received:2022-10-06
Revised:2023-01-17
Online:2023-12-28
Published:2023-12-29
作者简介:王姗(1993-),女,河北石家庄人。硕士生,研究方向为装备采购理论与应用。
基金资助:CLC Number:
Shan WANG, Hua ZHANG, Haowen SONG, Xiao CHEN. Coupling Coordination Analysis of Equipment Quality Chain Based on SDS-Coupling Coordination Degree Model[J]. Modern Defense Technology, 2023, 51(6): 133-145.
王姗, 张桦, 宋豪文, 陈晓. 基于SDS-耦合协调度模型的装备质量链耦合协调分析[J]. 现代防御技术, 2023, 51(6): 133-145.
Add to citation manager EndNote|Ris|BibTeX
URL: https://www.xdfyjs.cn/EN/10.3969/j.issn.1009-086x.2023.06.016
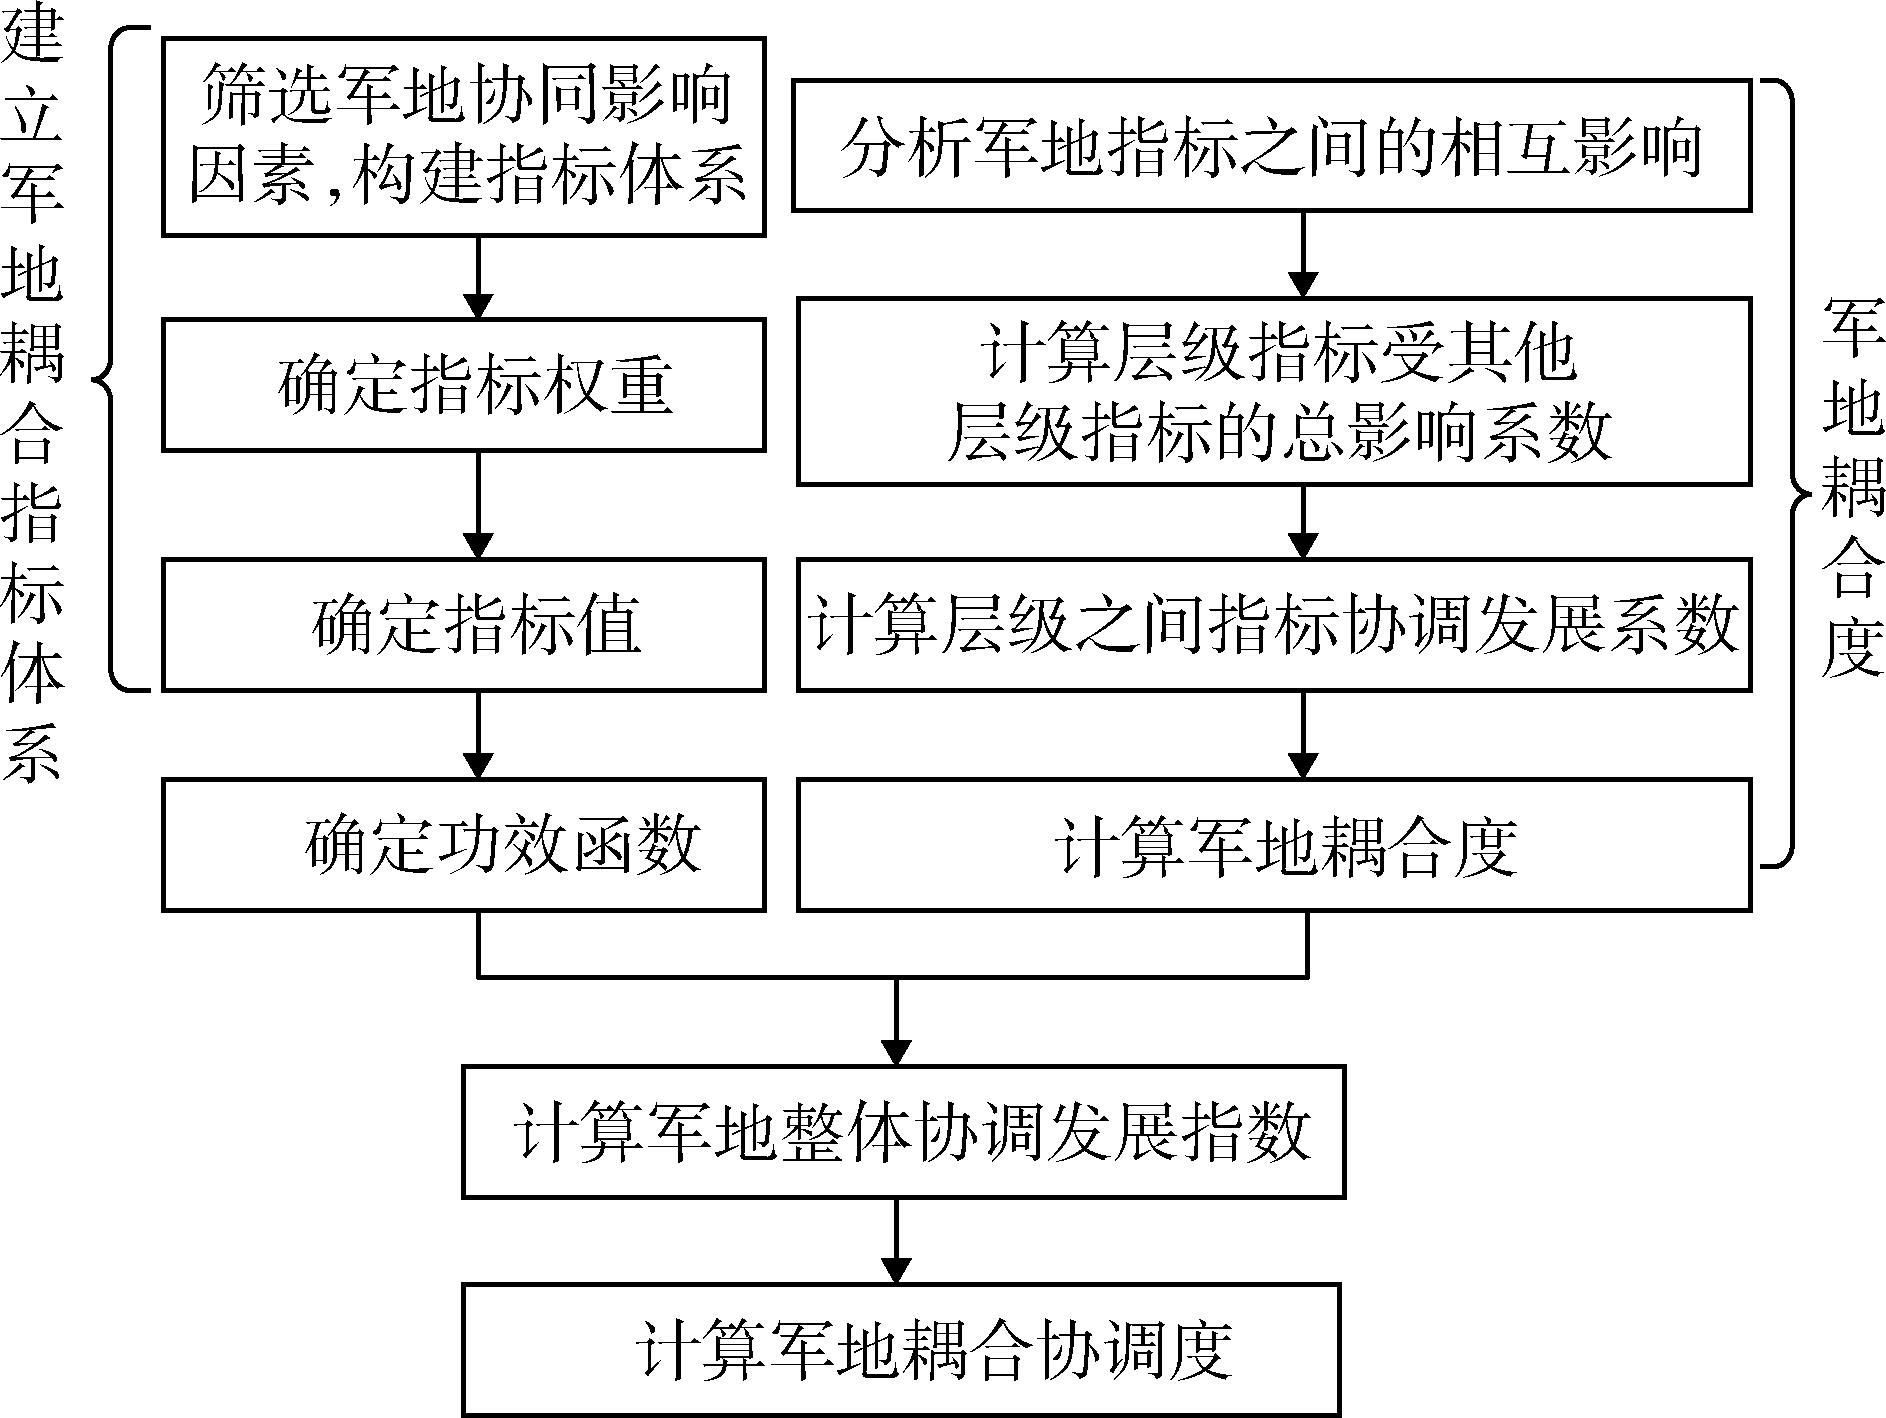
Fig. 1 Calculation steps of coupling coordinationbetween military and local systems
| 目标层 | 一级指标 | 二级指标 |
|---|---|---|
| 军地协同 | 决策层协同 | 质量目标一致性 |
| 组织结构对接水平 | ||
| 岗位划分情况 | ||
| 跨单位协同积极性 | ||
| 管理层协同 | 部门组织结构合理性 | |
| 职能部门专业化程度 | ||
| 跨部门协同水平 | ||
| 执行层协同 | 沟通效率 | |
| 人岗匹配程度 | ||
| 员工质量意识 | ||
| 员工协作水平 |
Table 1 Coupling indicator systems of military and local systems
| 目标层 | 一级指标 | 二级指标 |
|---|---|---|
| 军地协同 | 决策层协同 | 质量目标一致性 |
| 组织结构对接水平 | ||
| 岗位划分情况 | ||
| 跨单位协同积极性 | ||
| 管理层协同 | 部门组织结构合理性 | |
| 职能部门专业化程度 | ||
| 跨部门协同水平 | ||
| 执行层协同 | 沟通效率 | |
| 人岗匹配程度 | ||
| 员工质量意识 | ||
| 员工协作水平 |
| 定性描述 | A等于B | A稍强于B | A强于B | A很强于B | A明显强于B | A明显弱于B | A很弱于B | A弱于B | A稍弱于B |
|---|---|---|---|---|---|---|---|---|---|
| 量化比值 | 1 | 3 | 5 | 7 | 9 | 1/9 | 1/7 | 1/5 | 1/3 |
Table 2 Standard for semantic quantitative measurement of comparison degree
| 定性描述 | A等于B | A稍强于B | A强于B | A很强于B | A明显强于B | A明显弱于B | A很弱于B | A弱于B | A稍弱于B |
|---|---|---|---|---|---|---|---|---|---|
| 量化比值 | 1 | 3 | 5 | 7 | 9 | 1/9 | 1/7 | 1/5 | 1/3 |
| 协同程度 | 很好V1 | 较好V2 | 一般V3 | 较差V4 | 很差V5 |
|---|---|---|---|---|---|
| 分数F | 100 | 80 | 60 | 40 | 20 |
Table 3 Collaboration scoring standard
| 协同程度 | 很好V1 | 较好V2 | 一般V3 | 较差V4 | 很差V5 |
|---|---|---|---|---|---|
| 分数F | 100 | 80 | 60 | 40 | 20 |
| 一级指标 | 决策层协同 | 管理层协同 | 执行层协同 | 权重w | 一致性检验 |
|---|---|---|---|---|---|
| 决策层协同 | 1 | 7 | 3 | 0.669 4 | |
| 管理层协同 | 1/7 | 1 | 1/3 | 0.087 9 | 0.006 8 |
| 执行层协同 | 1/3 | 3 | 1 | 0.242 6 |
Table 4 Judgment matrix and calculation table of primary indicators
| 一级指标 | 决策层协同 | 管理层协同 | 执行层协同 | 权重w | 一致性检验 |
|---|---|---|---|---|---|
| 决策层协同 | 1 | 7 | 3 | 0.669 4 | |
| 管理层协同 | 1/7 | 1 | 1/3 | 0.087 9 | 0.006 8 |
| 执行层协同 | 1/3 | 3 | 1 | 0.242 6 |
| 二级指标 | 质量目标 | 组织结构 | 岗位划分 | 跨单位协同 | 权重w | 一致性检验 |
|---|---|---|---|---|---|---|
| 质量目标 | 1 | 3 | 5 | 7 | 0.591 1 | 0.015 2 |
| 组织结构 | 1/3 | 1 | 3 | 2 | 0.219 6 | |
| 岗位划分 | 1/5 | 1/3 | 1 | 1 | 0.0938 | |
| 跨单位协同 | 1/7 | 1/2 | 1 | 1 | 0.095 5 |
Table 5 Judgment matrix and calculation table of decision-making-level collaboration
| 二级指标 | 质量目标 | 组织结构 | 岗位划分 | 跨单位协同 | 权重w | 一致性检验 |
|---|---|---|---|---|---|---|
| 质量目标 | 1 | 3 | 5 | 7 | 0.591 1 | 0.015 2 |
| 组织结构 | 1/3 | 1 | 3 | 2 | 0.219 6 | |
| 岗位划分 | 1/5 | 1/3 | 1 | 1 | 0.0938 | |
| 跨单位协同 | 1/7 | 1/2 | 1 | 1 | 0.095 5 |
| 二级指标 | 组织结构 | 专业化水平 | 跨部门协同 | 权重w | 一致性检验 |
|---|---|---|---|---|---|
| 组织结构 | 1 | 5 | 3 | 0.637 0 | |
| 专业化水平 | 1/5 | 1 | 1/3 | 0.104 7 | 0.037 0 |
| 跨部门协同 | 1/3 | 3 | 1 | 0.258 3 |
Table 6 Judgment matrix and calculation table of management-level collaboration indicator
| 二级指标 | 组织结构 | 专业化水平 | 跨部门协同 | 权重w | 一致性检验 |
|---|---|---|---|---|---|
| 组织结构 | 1 | 5 | 3 | 0.637 0 | |
| 专业化水平 | 1/5 | 1 | 1/3 | 0.104 7 | 0.037 0 |
| 跨部门协同 | 1/3 | 3 | 1 | 0.258 3 |
| 二级指标 | 沟通效率 | 人岗匹配度 | 质量意识 | 协作水平 | 权重w | 一致性检验 |
|---|---|---|---|---|---|---|
| 沟通效率 | 1 | 1/5 | 3 | 5 | 0.224 1 | 0.076 4 |
| 人岗匹配度 | 5 | 1 | 5 | 7 | 0.619 4 | |
| 质量意识 | 1/3 | 1/5 | 1 | 1 | 0.086 5 | |
| 协作水平 | 1/5 | 1/7 | 1 | 1 | 0.070 0 |
Table 7 Judgment matrix and calculation table of executive-level collaboration indicators
| 二级指标 | 沟通效率 | 人岗匹配度 | 质量意识 | 协作水平 | 权重w | 一致性检验 |
|---|---|---|---|---|---|---|
| 沟通效率 | 1 | 1/5 | 3 | 5 | 0.224 1 | 0.076 4 |
| 人岗匹配度 | 5 | 1 | 5 | 7 | 0.619 4 | |
| 质量意识 | 1/3 | 1/5 | 1 | 1 | 0.086 5 | |
| 协作水平 | 1/5 | 1/7 | 1 | 1 | 0.070 0 |
| 协同程度 | 评价标准 |
|---|---|
| 很好V1 | 完全到达评价标准,且效果显著 |
| 较好V2 | 达到评价标准,且起到一定效果 |
| 一般V3 | 基本达到评价标准,但效果不明显 |
| 较差V4 | 未达到评价标准,且没有产生效果 |
| 很差V5 | 与评价标准有较大差距,且起到反作用 |
Table 8 Evaluation criteria of collaboration degree
| 协同程度 | 评价标准 |
|---|---|
| 很好V1 | 完全到达评价标准,且效果显著 |
| 较好V2 | 达到评价标准,且起到一定效果 |
| 一般V3 | 基本达到评价标准,但效果不明显 |
| 较差V4 | 未达到评价标准,且没有产生效果 |
| 很差V5 | 与评价标准有较大差距,且起到反作用 |
| 目标层 | 一级指标 | 权重 | 二级指标 | 权重w | 指标类型 |
|---|---|---|---|---|---|
| 军地协同U | 决策层协同U1 | 0.669 4 | 质量目标的一致性u11 | 0.591 1 | + |
| 组织结构对接水平u12 | 0.219 6 | + | |||
| 岗位划分情况u13 | 0.093 8 | + | |||
| 跨单位协同积极性u14 | 0.095 5 | + | |||
| 管理层协同U2 | 0.087 9 | 部门组织结构合理性u21 | 0.637 0 | + | |
| 职能部门专业化程度u22 | 0.104 7 | + | |||
| 跨部门协同水平u23 | 0.258 3 | + | |||
| 执行层协同U3 | 0.242 6 | 沟通效率u31 | 0.224 1 | + | |
| 人岗匹配程度u32 | 0.619 4 | + | |||
| 员工质量意识u33 | 0.086 5 | + | |||
| 员工协作水平u34 | 0.070 0 | + |
Table 9 Coupling indicator weight system of military and local systems
| 目标层 | 一级指标 | 权重 | 二级指标 | 权重w | 指标类型 |
|---|---|---|---|---|---|
| 军地协同U | 决策层协同U1 | 0.669 4 | 质量目标的一致性u11 | 0.591 1 | + |
| 组织结构对接水平u12 | 0.219 6 | + | |||
| 岗位划分情况u13 | 0.093 8 | + | |||
| 跨单位协同积极性u14 | 0.095 5 | + | |||
| 管理层协同U2 | 0.087 9 | 部门组织结构合理性u21 | 0.637 0 | + | |
| 职能部门专业化程度u22 | 0.104 7 | + | |||
| 跨部门协同水平u23 | 0.258 3 | + | |||
| 执行层协同U3 | 0.242 6 | 沟通效率u31 | 0.224 1 | + | |
| 人岗匹配程度u32 | 0.619 4 | + | |||
| 员工质量意识u33 | 0.086 5 | + | |||
| 员工协作水平u34 | 0.070 0 | + |
| 协同程度 | 评价指标 | ||||||||||
|---|---|---|---|---|---|---|---|---|---|---|---|
| r1 | r2 | r3 | |||||||||
| r11 | r12 | r13 | r14 | r21 | r22 | r23 | r31 | r32 | r33 | r34 | |
| 很好V1 | 0.11 | 0.07 | 0.04 | 0.16 | 0.07 | 0.01 | 0.02 | 0.02 | 0.17 | 0.18 | 0.14 |
| 较好V2 | 0.37 | 0.12 | 0.28 | 0.15 | 0.22 | 0.17 | 0.05 | 0.23 | 0.33 | 0.41 | 0.33 |
| 一般V3 | 0.21 | 0.46 | 0.53 | 0.48 | 0.47 | 0.38 | 0.23 | 0.46 | 0.27 | 0.25 | 0.34 |
| 较差V4 | 0.18 | 0.29 | 0.07 | 0.13 | 0.19 | 0.43 | 0.67 | 0.25 | 0.14 | 0.11 | 0.16 |
| 很差V5 | 0.13 | 0.06 | 0.08 | 0.08 | 0.05 | 0.01 | 0.03 | 0.04 | 0.09 | 0.05 | 0.03 |
Table 10 Indicator membership
| 协同程度 | 评价指标 | ||||||||||
|---|---|---|---|---|---|---|---|---|---|---|---|
| r1 | r2 | r3 | |||||||||
| r11 | r12 | r13 | r14 | r21 | r22 | r23 | r31 | r32 | r33 | r34 | |
| 很好V1 | 0.11 | 0.07 | 0.04 | 0.16 | 0.07 | 0.01 | 0.02 | 0.02 | 0.17 | 0.18 | 0.14 |
| 较好V2 | 0.37 | 0.12 | 0.28 | 0.15 | 0.22 | 0.17 | 0.05 | 0.23 | 0.33 | 0.41 | 0.33 |
| 一般V3 | 0.21 | 0.46 | 0.53 | 0.48 | 0.47 | 0.38 | 0.23 | 0.46 | 0.27 | 0.25 | 0.34 |
| 较差V4 | 0.18 | 0.29 | 0.07 | 0.13 | 0.19 | 0.43 | 0.67 | 0.25 | 0.14 | 0.11 | 0.16 |
| 很差V5 | 0.13 | 0.06 | 0.08 | 0.08 | 0.05 | 0.01 | 0.03 | 0.04 | 0.09 | 0.05 | 0.03 |
| 目标层 | 指标 | 目标值Oij | 周期Ⅰ | 周期Ⅱ | 周期Ⅲ | 周期Ⅳ | 周期Ⅴ | 周期Ⅵ | 周期Ⅶ |
|---|---|---|---|---|---|---|---|---|---|
| 决策层协同U1 | u11 | 62.2 | 63.0 | 62.3 | 63.5 | 64.0 | 64.3 | 64.7 | 63.4 |
| u12 | 56.5 | 57.0 | 56.8 | 57.1 | 57.3 | 57.2 | 57.0 | 56.7 | |
| u13 | 62.2 | 62.6 | 63.0 | 62.7 | 62.3 | 62.4 | 62.1 | 62.5 | |
| u14 | 63.4 | 63.6 | 63.5 | 63.6 | 64.0 | 66.1 | 67.0 | 65.3 | |
| 管理层协同U2 | u21 | 61.1 | 61.4 | 61.6 | 61.3 | 61.5 | 61.4 | 61.2 | 61.0 |
| u22 | 54.7 | 4.8 | 55.0 | 56.1 | 56.5 | 56.8 | 57.4 | 55.3 | |
| u23 | 47.1 | 47.2 | 47.5 | 47.4 | 47.3 | 47.4 | 47.3 | 47.4 | |
| 执行层协同U3 | u31 | 58.4 | 58.8 | 58.5 | 58.6 | 58.7 | 58.9 | 58.8 | 58.4 |
| u32 | 66.7 | 66.8 | 68.0 | 69.0 | 68.7 | 68.9 | 69.1 | 67.9 | |
| u33 | 71.1 | 71.2 | 72.2 | 72.4 | 73.3 | 73.7 | 74.2 | 73.5 | |
| u34 | 67.4 | 67.8 | 67.7 | 67.9 | 67.5 | 67.7 | 67.6 | 67.7 |
Table 11 Indicator value and target value in each cycle of prototype development stage
| 目标层 | 指标 | 目标值Oij | 周期Ⅰ | 周期Ⅱ | 周期Ⅲ | 周期Ⅳ | 周期Ⅴ | 周期Ⅵ | 周期Ⅶ |
|---|---|---|---|---|---|---|---|---|---|
| 决策层协同U1 | u11 | 62.2 | 63.0 | 62.3 | 63.5 | 64.0 | 64.3 | 64.7 | 63.4 |
| u12 | 56.5 | 57.0 | 56.8 | 57.1 | 57.3 | 57.2 | 57.0 | 56.7 | |
| u13 | 62.2 | 62.6 | 63.0 | 62.7 | 62.3 | 62.4 | 62.1 | 62.5 | |
| u14 | 63.4 | 63.6 | 63.5 | 63.6 | 64.0 | 66.1 | 67.0 | 65.3 | |
| 管理层协同U2 | u21 | 61.1 | 61.4 | 61.6 | 61.3 | 61.5 | 61.4 | 61.2 | 61.0 |
| u22 | 54.7 | 4.8 | 55.0 | 56.1 | 56.5 | 56.8 | 57.4 | 55.3 | |
| u23 | 47.1 | 47.2 | 47.5 | 47.4 | 47.3 | 47.4 | 47.3 | 47.4 | |
| 执行层协同U3 | u31 | 58.4 | 58.8 | 58.5 | 58.6 | 58.7 | 58.9 | 58.8 | 58.4 |
| u32 | 66.7 | 66.8 | 68.0 | 69.0 | 68.7 | 68.9 | 69.1 | 67.9 | |
| u33 | 71.1 | 71.2 | 72.2 | 72.4 | 73.3 | 73.7 | 74.2 | 73.5 | |
| u34 | 67.4 | 67.8 | 67.7 | 67.9 | 67.5 | 67.7 | 67.6 | 67.7 |
| 目标层 | 指标 | 周期Ⅰ | 周期Ⅱ | 周期Ⅲ | 周期Ⅳ | 周期Ⅴ | 周期Ⅵ | 周期Ⅶ |
|---|---|---|---|---|---|---|---|---|
| 决策层协同 | 0.197 4 | 0.025 0 | 0.314 0 | 0.421 9 | 0.481 5 | 0.554 6 | 0.635 1 | |
| 0.124 4 | 0.074 9 | 0.148 9 | 0.197 4 | 0.173 2 | 0.124 4 | 0.197 4 | ||
| 0.099 7 | 0.197 4 | 0.124 4 | 0.025 0 | 0.050 0 | -0.025 0 | 0.074 9 | ||
| 0.050 0 | 0.025 0 | 0.050 0 | 0.148 9 | 0.588 3 | 0.716 3 | 0.750 9 | ||
| 管理层协同 | 0.074 9 | 0.124 4 | 0.050 0 | 0.099 7 | 0.074 9 | 0.025 0 | 0.050 0 | |
| 0.025 0 | 0.074 9 | 0.336 4 | 0.421 9 | 0.481 5 | 0.588 3 | 0.620 0 | ||
| 0.025 0 | 0.099 7 | 0.074 9 | 0.050 0 | 0.074 9 | 0.050 0 | 0.025 0 | ||
| 执行层协同 | 0.099 7 | 0.025 0 | 0.050 0 | 0.074 9 | 0.124 4 | 0.099 7 | 0.074 9 | |
| 0.025 0 | 0.314 0 | 0.519 0 | 0.462 1 | 0.500 5 | 0.537 0 | 0.588 3 | ||
| 0.025 0 | 0.268 3 | 0.314 0 | 0.500 5 | 0.571 7 | 0.649 8 | 0.703 9 | ||
| 0.099 7 | 0.074 9 | 0.124 4 | 0.025 0 | 0.074 9 | 0.050 0 | 0.124 4 |
Table 12 Indicator efficacy values in each cycle of prototype development stage
| 目标层 | 指标 | 周期Ⅰ | 周期Ⅱ | 周期Ⅲ | 周期Ⅳ | 周期Ⅴ | 周期Ⅵ | 周期Ⅶ |
|---|---|---|---|---|---|---|---|---|
| 决策层协同 | 0.197 4 | 0.025 0 | 0.314 0 | 0.421 9 | 0.481 5 | 0.554 6 | 0.635 1 | |
| 0.124 4 | 0.074 9 | 0.148 9 | 0.197 4 | 0.173 2 | 0.124 4 | 0.197 4 | ||
| 0.099 7 | 0.197 4 | 0.124 4 | 0.025 0 | 0.050 0 | -0.025 0 | 0.074 9 | ||
| 0.050 0 | 0.025 0 | 0.050 0 | 0.148 9 | 0.588 3 | 0.716 3 | 0.750 9 | ||
| 管理层协同 | 0.074 9 | 0.124 4 | 0.050 0 | 0.099 7 | 0.074 9 | 0.025 0 | 0.050 0 | |
| 0.025 0 | 0.074 9 | 0.336 4 | 0.421 9 | 0.481 5 | 0.588 3 | 0.620 0 | ||
| 0.025 0 | 0.099 7 | 0.074 9 | 0.050 0 | 0.074 9 | 0.050 0 | 0.025 0 | ||
| 执行层协同 | 0.099 7 | 0.025 0 | 0.050 0 | 0.074 9 | 0.124 4 | 0.099 7 | 0.074 9 | |
| 0.025 0 | 0.314 0 | 0.519 0 | 0.462 1 | 0.500 5 | 0.537 0 | 0.588 3 | ||
| 0.025 0 | 0.268 3 | 0.314 0 | 0.500 5 | 0.571 7 | 0.649 8 | 0.703 9 | ||
| 0.099 7 | 0.074 9 | 0.124 4 | 0.025 0 | 0.074 9 | 0.050 0 | 0.124 4 |
| 子系统 | 周期Ⅰ | 周期Ⅱ | 周期Ⅲ | 周期Ⅳ | 周期Ⅴ | 周期Ⅵ | 周期Ⅶ |
|---|---|---|---|---|---|---|---|
| 决策层U1 | 0.158 1 | 0.052 1 | 0.234 7 | 0.309 3 | 0.383 6 | 0.421 2 | 0.497 5 |
| 管理层U2 | 0.056 8 | 0.112 8 | 0.086 4 | 0.120 6 | 0.117 4 | 0.090 4 | 0.103 2 |
| 执行层U3 | 0.047 0 | 0.228 6 | 0.368 5 | 0.348 1 | 0.392 6 | 0.417 4 | 0.450 7 |
Table 13 Coordinated development coefficient of subsystems in each cycle of prototype development stage
| 子系统 | 周期Ⅰ | 周期Ⅱ | 周期Ⅲ | 周期Ⅳ | 周期Ⅴ | 周期Ⅵ | 周期Ⅶ |
|---|---|---|---|---|---|---|---|
| 决策层U1 | 0.158 1 | 0.052 1 | 0.234 7 | 0.309 3 | 0.383 6 | 0.421 2 | 0.497 5 |
| 管理层U2 | 0.056 8 | 0.112 8 | 0.086 4 | 0.120 6 | 0.117 4 | 0.090 4 | 0.103 2 |
| 执行层U3 | 0.047 0 | 0.228 6 | 0.368 5 | 0.348 1 | 0.392 6 | 0.417 4 | 0.450 7 |
| 目标层 | 指标 | |||||||||||
|---|---|---|---|---|---|---|---|---|---|---|---|---|
| -0.70 | 0.96 | -0.53 | 0.57 | 0.74 | 0.86 | 0.01 | ||||||
| -0.27 | 0.65 | -0.49 | 0.41 | 0.55 | 0.57 | 0.00 | ||||||
| 0.60 | -0.72 | 0.50 | -0.73 | -0.44 | -0.62 | 0.49 | ||||||
| -0.64 | 0.88 | -0.37 | 0.52 | 0.67 | 0.89 | 0.02 | ||||||
| -0.06 | -0.27 | 0.60 | -0.64 | -0.45 | -0.50 | -0.47 | -0.31 | |||||
| 0.96 | 0.65 | -0.72 | 0.88 | 0.38 | -0.90 | 0.97 | -0.08 | |||||
| -0.53 | -0.49 | 0.50 | -0.37 | -0.48 | 0.06 | -0.18 | -0.16 | |||||
| 0.54 | 0.41 | -0.73 | 0.52 | -0.45 | 0.38 | -0.48 | ||||||
| 0.74 | 0.53 | -0.42 | 0.65 | -0.50 | 0.90 | 0.06 | ||||||
| 0.90 | 0.90 | -0.62 | 0.89 | -0.47 | 0.97 | -0.18 | ||||||
| 0.00 | 0.00 | 0.49 | 0.02 | -0.31 | -0.08 | -0.16 |
Table 14 Correlation coefficient αijpq between indicators
| 目标层 | 指标 | |||||||||||
|---|---|---|---|---|---|---|---|---|---|---|---|---|
| -0.70 | 0.96 | -0.53 | 0.57 | 0.74 | 0.86 | 0.01 | ||||||
| -0.27 | 0.65 | -0.49 | 0.41 | 0.55 | 0.57 | 0.00 | ||||||
| 0.60 | -0.72 | 0.50 | -0.73 | -0.44 | -0.62 | 0.49 | ||||||
| -0.64 | 0.88 | -0.37 | 0.52 | 0.67 | 0.89 | 0.02 | ||||||
| -0.06 | -0.27 | 0.60 | -0.64 | -0.45 | -0.50 | -0.47 | -0.31 | |||||
| 0.96 | 0.65 | -0.72 | 0.88 | 0.38 | -0.90 | 0.97 | -0.08 | |||||
| -0.53 | -0.49 | 0.50 | -0.37 | -0.48 | 0.06 | -0.18 | -0.16 | |||||
| 0.54 | 0.41 | -0.73 | 0.52 | -0.45 | 0.38 | -0.48 | ||||||
| 0.74 | 0.53 | -0.42 | 0.65 | -0.50 | 0.90 | 0.06 | ||||||
| 0.90 | 0.90 | -0.62 | 0.89 | -0.47 | 0.97 | -0.18 | ||||||
| 0.00 | 0.00 | 0.49 | 0.02 | -0.31 | -0.08 | -0.16 |
| 指标 | 决策层 | 管理层 | 执行层 | 总影响相关系数 |
|---|---|---|---|---|
| -0.041 4 | 0.094 4 | 0.053 0 | ||
| -0.016 3 | 0.068 1 | 0.051 7 | ||
| 0.039 6 | -0.050 2 | -0.010 6 | ||
| -0.035 3 | 0.092 6 | 0.057 3 | ||
| -0.017 9 | -0.098 7 | -0.116 6 | ||
| 0.242 7 | 0.076 1 | 0.318 8 | ||
| -0.133 6 | -0.065 3 | -0.198 9 | ||
| 0.109 9 | -0.035 8 | 0.074 1 | ||
| 0.204 4 | -0.010 3 | 0.194 1 | ||
| 0.270 9 | -0.015 8 | 0.255 1 | ||
| 0.049 2 | -0.029 1 | 0.020 1 |
Table 15 Correlation coefficient of impact of indicators at other levels on indicators at all levels
| 指标 | 决策层 | 管理层 | 执行层 | 总影响相关系数 |
|---|---|---|---|---|
| -0.041 4 | 0.094 4 | 0.053 0 | ||
| -0.016 3 | 0.068 1 | 0.051 7 | ||
| 0.039 6 | -0.050 2 | -0.010 6 | ||
| -0.035 3 | 0.092 6 | 0.057 3 | ||
| -0.017 9 | -0.098 7 | -0.116 6 | ||
| 0.242 7 | 0.076 1 | 0.318 8 | ||
| -0.133 6 | -0.065 3 | -0.198 9 | ||
| 0.109 9 | -0.035 8 | 0.074 1 | ||
| 0.204 4 | -0.010 3 | 0.194 1 | ||
| 0.270 9 | -0.015 8 | 0.255 1 | ||
| 0.049 2 | -0.029 1 | 0.020 1 |
| 指标 | 系数 | 指标 | 系数 | 指标 | 系数 |
|---|---|---|---|---|---|
| 0.232 3 | -0.992 7 | 0.235 9 | |||
| 0.363 7 | -0.007 4 | 0.563 8 | |||
| -0.024 3 | -0.289 8 | 0.606 2 | |||
| 0.282 9 | 0.029 4 |
Table 16 Coordinated development coefficient Gij within the hierarchy
| 指标 | 系数 | 指标 | 系数 | 指标 | 系数 |
|---|---|---|---|---|---|
| 0.232 3 | -0.992 7 | 0.235 9 | |||
| 0.363 7 | -0.007 4 | 0.563 8 | |||
| -0.024 3 | -0.289 8 | 0.606 2 | |||
| 0.282 9 | 0.029 4 |
| 系数 | 周期Ⅰ | 周期Ⅱ | 周期Ⅲ | 周期Ⅳ | 周期Ⅴ | 周期Ⅵ | 周期Ⅶ |
|---|---|---|---|---|---|---|---|
| G1 | 0.026 8 | 0.001 5 | 0.096 2 | 0.156 6 | 0.231 6 | 0.270 6 | 0.285 8 |
| G2 | -0.008 2 | 0.008 2 | 0.088 5 | 0.115 5 | 0.138 0 | 0.175 8 | 0.182 8 |
| G3 | 0.029 5 | -0.002 1 | 0.137 1 | 0.188 0 | 0.241 9 | 0.269 0 | 0.285 3 |
Table 17 Coordinated development coefficient Gi among management levels
| 系数 | 周期Ⅰ | 周期Ⅱ | 周期Ⅲ | 周期Ⅳ | 周期Ⅴ | 周期Ⅵ | 周期Ⅶ |
|---|---|---|---|---|---|---|---|
| G1 | 0.026 8 | 0.001 5 | 0.096 2 | 0.156 6 | 0.231 6 | 0.270 6 | 0.285 8 |
| G2 | -0.008 2 | 0.008 2 | 0.088 5 | 0.115 5 | 0.138 0 | 0.175 8 | 0.182 8 |
| G3 | 0.029 5 | -0.002 1 | 0.137 1 | 0.188 0 | 0.241 9 | 0.269 0 | 0.285 3 |
| 周期Ⅰ | 周期Ⅱ | 周期Ⅲ | 周期Ⅳ | 周期Ⅴ | 周期Ⅵ | 周期Ⅶ |
|---|---|---|---|---|---|---|
| 0.083 1 | 0.060 6 | 0.194 7 | 0.245 5 | 0.307 7 | 0.339 0 | 0.381 5 |
Table 18 Overall coordinated development index T of military and local systems
| 周期Ⅰ | 周期Ⅱ | 周期Ⅲ | 周期Ⅳ | 周期Ⅴ | 周期Ⅵ | 周期Ⅶ |
|---|---|---|---|---|---|---|
| 0.083 1 | 0.060 6 | 0.194 7 | 0.245 5 | 0.307 7 | 0.339 0 | 0.381 5 |
| 项目 | 周期Ⅰ | 周期Ⅱ | 周期Ⅲ | 周期Ⅳ | 周期Ⅴ | 周期Ⅵ | 周期Ⅶ |
|---|---|---|---|---|---|---|---|
| U1 | 0.158 1 | 0.052 1 | 0.234 7 | 0.309 3 | 0.383 6 | 0.421 2 | 0.497 5 |
| U2 | 0.056 8 | 0.112 8 | 0.086 4 | 0.120 6 | 0.117 4 | 0.090 4 | 0.103 2 |
| U3 | 0.047 0 | 0.228 6 | 0.368 5 | 0.348 1 | 0.392 6 | 0.414 7 | 0.450 7 |
| Umax | 0.158 1 | 0.228 6 | 0.368 5 | 0.348 1 | 0.392 6 | 0.421 2 | 0.497 5 |
| C | 0.562 9 | 0.532 7 | 0.562 4 | 0.683 1 | 0.670 0 | 0.597 3 | 0.557 9 |
Table 19 Coupling C between management levels
| 项目 | 周期Ⅰ | 周期Ⅱ | 周期Ⅲ | 周期Ⅳ | 周期Ⅴ | 周期Ⅵ | 周期Ⅶ |
|---|---|---|---|---|---|---|---|
| U1 | 0.158 1 | 0.052 1 | 0.234 7 | 0.309 3 | 0.383 6 | 0.421 2 | 0.497 5 |
| U2 | 0.056 8 | 0.112 8 | 0.086 4 | 0.120 6 | 0.117 4 | 0.090 4 | 0.103 2 |
| U3 | 0.047 0 | 0.228 6 | 0.368 5 | 0.348 1 | 0.392 6 | 0.414 7 | 0.450 7 |
| Umax | 0.158 1 | 0.228 6 | 0.368 5 | 0.348 1 | 0.392 6 | 0.421 2 | 0.497 5 |
| C | 0.562 9 | 0.532 7 | 0.562 4 | 0.683 1 | 0.670 0 | 0.597 3 | 0.557 9 |
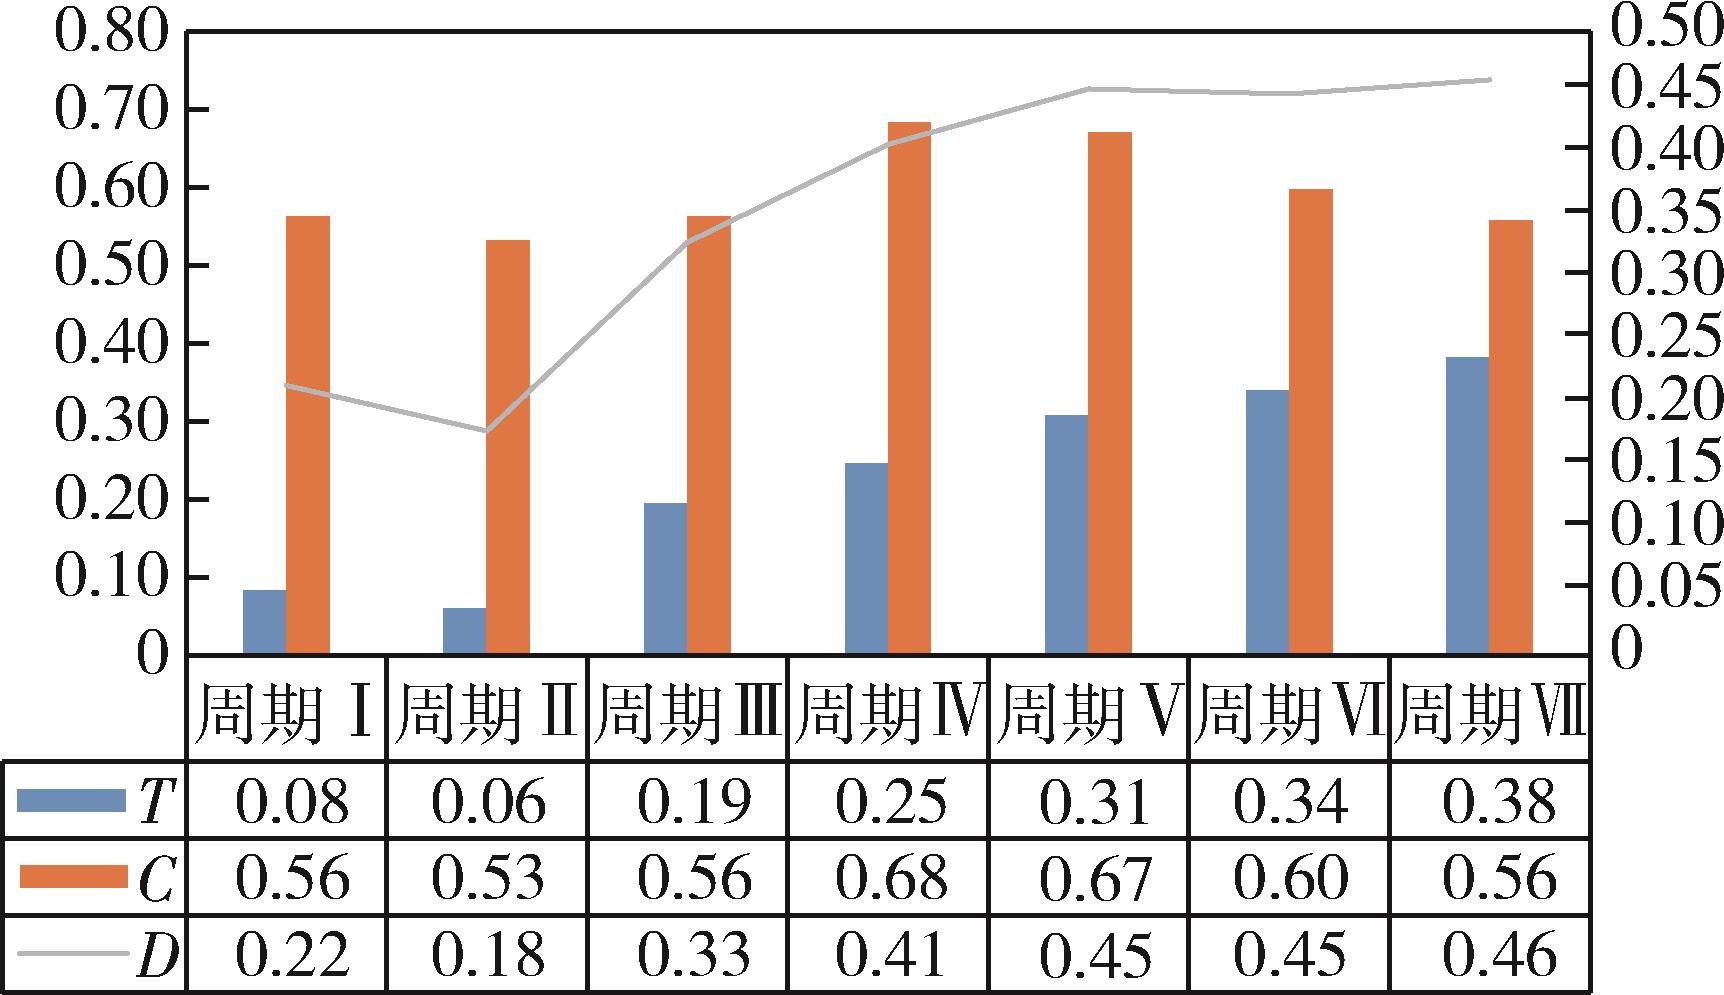
Fig.2 Overall coupling coordination of military and local systems
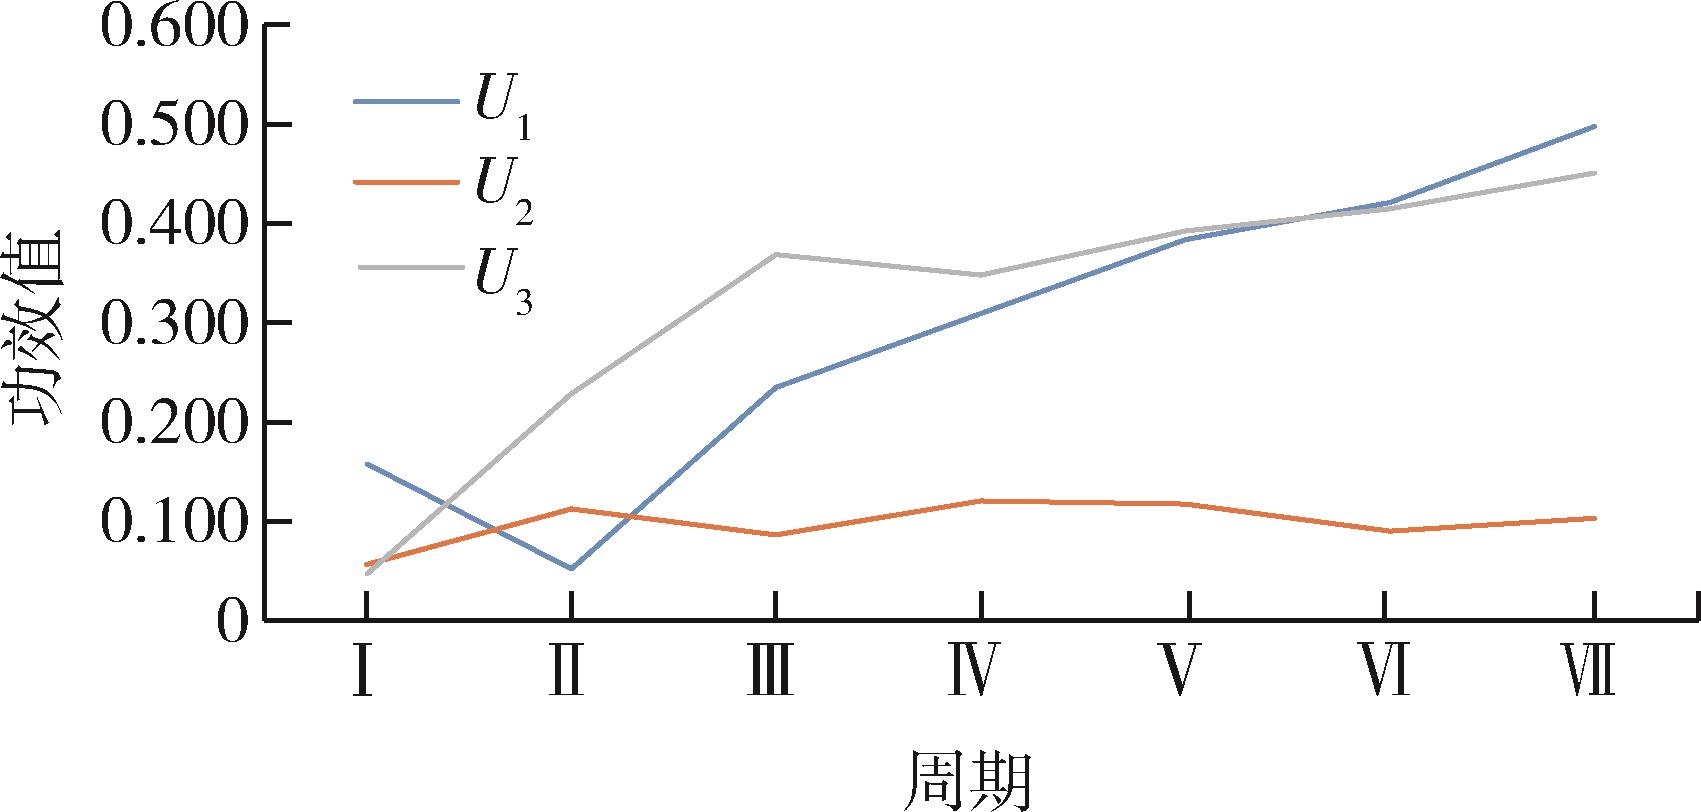
Fig. 3 Development trend of internal coordination at all levels
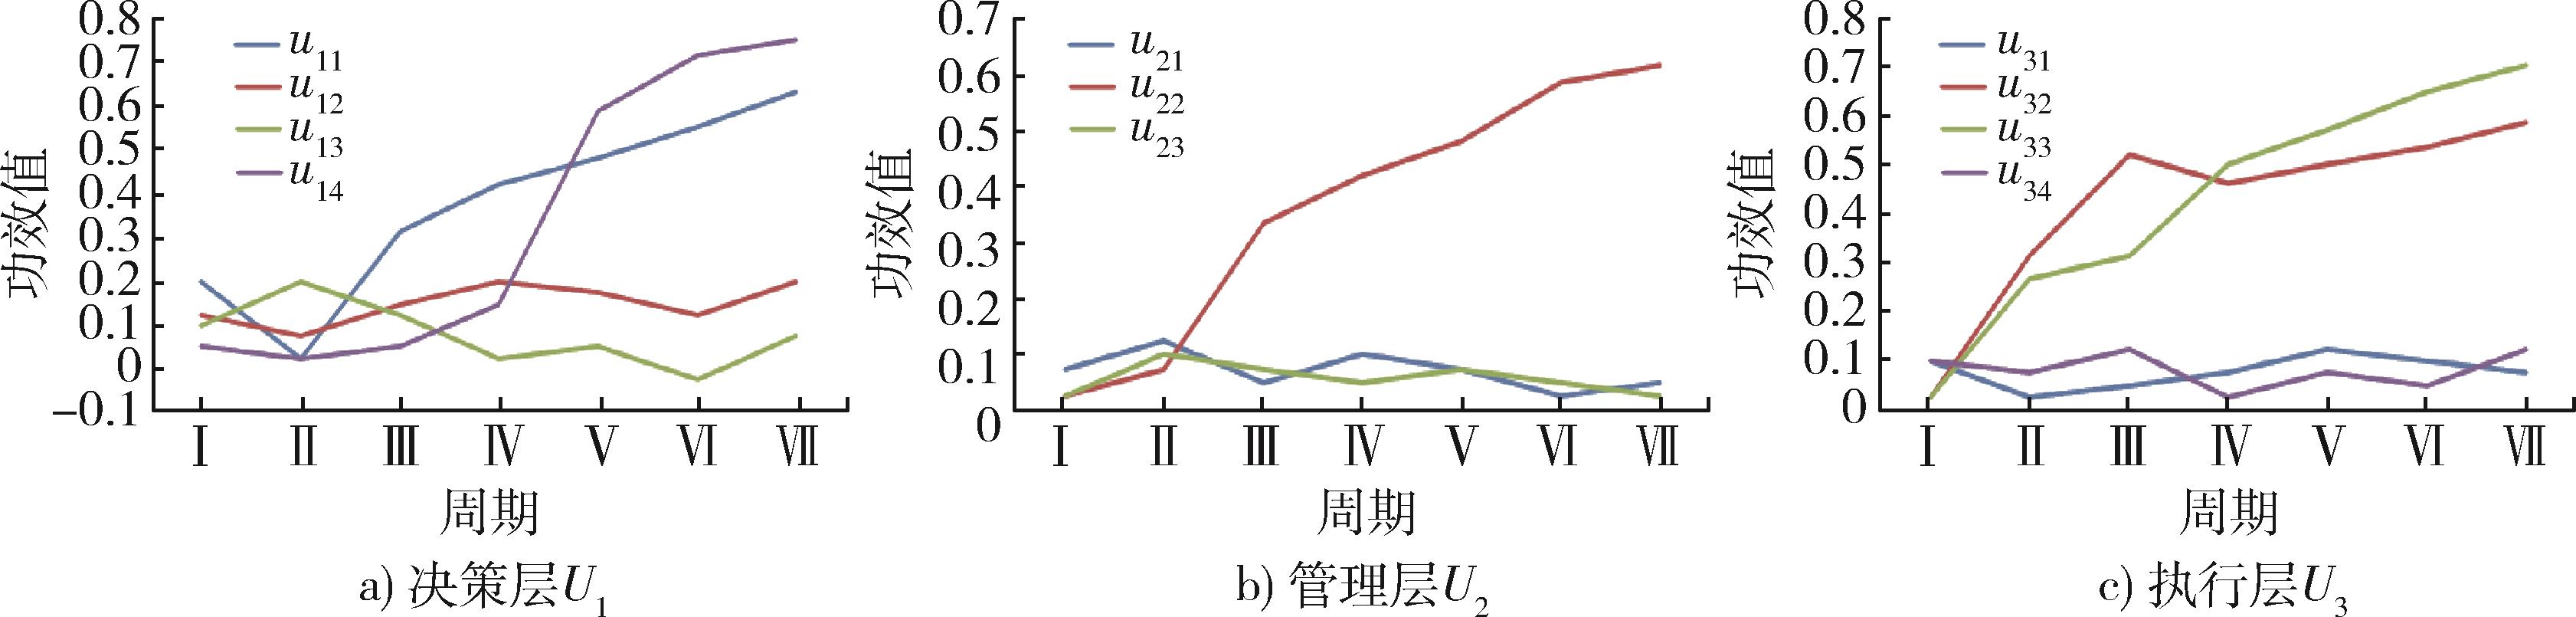
Fig. 4 Change trend of indictor efficacy value
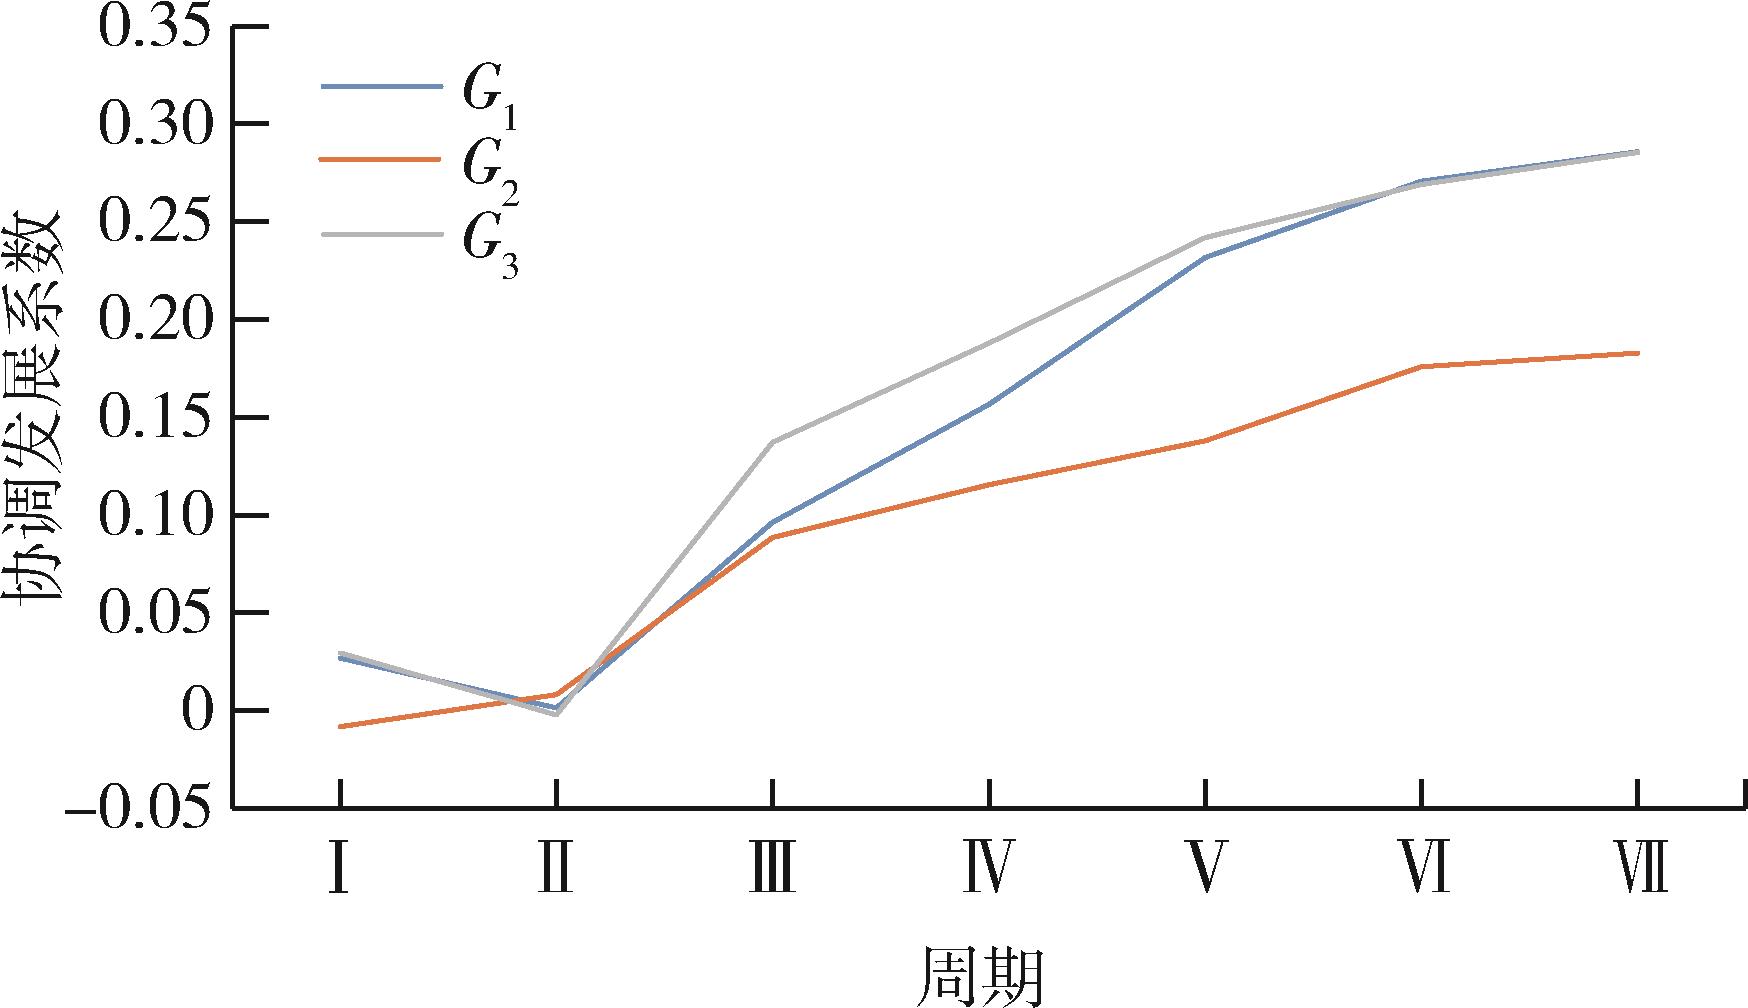
Fig. 5 Coordinated development among all levels
| 1 | 总装技术基础管理中心质量组. 加强新时期装备质量管理工作的思考[J]. 装备质量, 2013(5): 2-9. |
| Quality Group of General Assembly Technology Foundation Management Center. Reflections on Strengthening Equipment Quality Management in the New Era[J]. Equipment Quality, 2013(5): 2-9. | |
| 2 | 刘亮, 王明鉴. 浅谈基于质量链的装备质量管理[J]. 国防技术基础, 2012(6): 15-17. |
| LIU Liang, WANG Mingjian. On Equipment Quality Management Based on Quality Chain[J]. Technology Foundation of National Defence, 2012(6): 15-17. | |
| 3 | 孔庆田. 我国武器装备质量管理形势及发展对策研究[J]. 装备学术, 2014(2): 38-41. |
| KONG Qingtian. Research on the Situation and Development Countermeasures of China's Weapon Equipment Quality Management[J]. Equipment Academic, 2014(2): 38-41. | |
| 4 | 崔向华, 方福生. 部队装备质量反馈问题研究[J]. 装备学院学报, 2014, 25(6): 22-25. |
| CUI Xianghua, FANG Fusheng. Research on Feedback Problems of Troops Equipment Quality[J]. Journal of Equipment Academy, 2014, 25(6): 22-25. | |
| 5 | 易炜, 刘有云. 以可靠性为中心的装备质量管理方法[J]. 贵州航空动力设计, 2017, 138: 26-30. |
| YI Wei, LIU Youyun. Reliability Centered Equipment Quality Management Method[J]. Guizhou Aviation Power Design, 2017, 138: 26-30. | |
| 6 | 穆菁, 王斌, 王石博, 等. 基于过程的武器装备质量管理体系构建方法[J]. 质量与可靠性, 2020(1): 35-38. |
| MU Jing, WANG Bin, WANG Shibo, et al. Construction Method of Weapon Equipment Quality Management System Based on Process[J]. Quality and Reliability, 2020(1): 35-38. | |
| 7 | 淦元柳. 武器装备质量管理体系运行中存在的问题及对策[J]. 空军装备, 2015(4): 53-54. |
| GAN Yuanliu. Problems and Countermeasures in the Operation of Weapon Equipment Quality Management System[J]. Air Force Equipment, 2015(4): 53-54. | |
| 8 | 严剑峰. 国防科技工业领域军民协同发展的主要障碍与对策(上)[J]. 军民两用技术与产品, 2020(9): 8-13. |
| YAN Jianfeng. The Main Obstacles and Countermeasures of the Military-Civilian Coordinated Development in the Field of Defense Technology and Industry(I)[J]. Dual Use Technologies & Products, 2020(9): 8-13. | |
| 9 | 严剑峰. 国防科技工业领域军民协同发展的主要障碍与对策(下)[J]. 军民两用技术与产品, 2020(10): 8-12. |
| YAN Jianfeng. Main Obstacles and Countermeasures for the Coordinated Development of Military and Civilian in the Field of Defense Science and Technology Industry(II)[J]. Dual Use Technologies & Products, 2020(10): 8-12. | |
| 10 | 曾珍香. 可持续发展协调性分析[J]. 系统工程理论与实践, 2001, 21(3): 18-21. |
| ZENG Zhenxiang. The Analysis of Coordination and Sustainable Development[J]. Systems Engineering-Theory & Practice, 2001, 21(3): 18-21. | |
| 11 | 石全, 王立欣, 史宪铭, 等. 系统决策与建模[M]. 北京: 国防工业出版社, 2016. |
| SHI Quan, WANG Lixin, SHI Xianming, et al. Decision and Modeling of Systems[M]. Beijing: National Defense Industry Press, 2016. | |
| 12 | 陈水利, 李敬功, 王向公. 模糊集理论及其应用[M]. 北京: 科学出版社, 2005. |
| CHEN Shuili, LI Jinggong, WANG Xianggong. Fuzzy Set Theory and Its Application[M]. Beijing: Science Press, 2005. | |
| 13 | 王少剑, 方创琳, 王洋. 京津冀地区城市化与生态环境交互耦合关系定量测度[J]. 生态学报, 2015, 35(7): 2244-2254. |
| WANG Shaojian, FANG Chuanglin, WANG Yang. Quantitative Investigation of the Interactive Coupling Relationship Between Urbanization and Eco-Environment[J]. Acta Ecologica Sinica, 2015, 35(7): 2244-2254. | |
| 14 | 王淑佳, 孔伟, 任亮, 等. 国内耦合协调度模型的误区及修正[J]. 自然资源学报, 2021, 36(3): 793-810. |
| WANG Shujia, KONG Wei, REN Liang, et al. Research on Misuses and Modification of Coupling Coordination Degree Model in China[J]. Journal of Natural Resources, 2021, 36(3): 793-810. |
| [1] | Yuqian WANG, Yajie CAO, Xiaoqiong SHE, Yongyi LIAO. Research on U.S. Military’s Kill Web Concept and Inspiration to Chinese Air Defense Combat Equipment System [J]. Modern Defense Technology, 2023, 51(6): 1-8. |
| [2] | Wenzhuo TANG, Tianqi CAI, Changhui ZHUANG, Rui MIN. Equipment System of Systems(SoS)Engineering Method and Digitalization [J]. Modern Defense Technology, 2023, 51(4): 10-15. |
| [3] | Mengqing HOU, Siliang HUA, Jiuzhou ZHOU, Jia HAO. Research on Time Unity Technology for Live Combat Training [J]. Modern Defense Technology, 2023, 51(1): 17-25. |
| [4] | Zhe YAN, Min-le WANG, Jiang-peng WANG, Feng-xuan WU, Shao-qiang YAN. Scheduling of Special Support Vehicles at Naval Aviation Station with Time Windows [J]. Modern Defense Technology, 2022, 50(6): 117-123. |
| [5] | Sen LI, Hai-lin TIAN, Gang WANG, Da-xi LI, Jing WU. Research on IAMD Battle Command System(IBCS)of the US [J]. Modern Defense Technology, 2022, 50(4): 84-100. |
| [6] | Wei LI, Ying-qi LU. Threat Assessment Method of Air Attack Target Based on Clustering Combination Weighting [J]. Modern Defense Technology, 2022, 50(3): 17-24. |
| [7] | Bing XIAO, Feng-zeng LIU, Yi-shuai QIN. Research on the Structure Adaptability of Early Warning Intelligence System-of-Systems Based on Complex Network [J]. Modern Defense Technology, 2022, 50(2): 1-10. |
| [8] | Yong-jian ZHANG, Peng KANG, Zhi-min ZHUO, Da-guo ZHENG. Research on a Defense System Survivability Measurement Method [J]. Modern Defense Technology, 2022, 50(2): 33-38. |
| [9] | Min DU, Zhong-hua CHENG, En-zhi DONG. Summary of Equipment System Contribution Rate Evaluation [J]. Modern Defense Technology, 2022, 50(1): 7-18. |
| [10] | XU Qiang, JIN Zhen-zhong, YANG Ji-kun. Research on Establishment Method of Evaluation Index System for Operational Test of Warships [J]. Modern Defense Technology, 2021, 49(3): 47-54. |
| [11] | TANG Run-ze, ZHANG Cheng-long, LI Lin-lin, WANG Shi-kai. Research on Applications and Key Technologies of Multi-Weapons in Cross-Domain Intelligent Coordination Air Combat [J]. Modern Defense Technology, 2021, 49(2): 26-34. |
| [12] | ZONG Kai-bin, ZHANG Cheng-long, XUE Chen-xi. Requirement Generation Mechanism in Defense Acquisition Process [J]. Modern Defense Technology, 2021, 49(1): 18-26. |
| [13] | ZHANG Ming-zhi, XIA Lu. Effectiveness Evaluation Method for Battle Chain of OODA Loop Based on F-GERT Network [J]. Modern Defense Technology, 2020, 48(6): 12-18. |
| [14] | WANG Hao. Study on the Operational Effectiveness Evaluation of the Ship Formation Air Defense System Based on OODA [J]. Modern Defense Technology, 2020, 48(6): 19-25. |
| [15] | LI Sen, ZHANG Tao, CHEN Gang, YAO Xiao-qiang, MA Chao. Integrated Air and Missile Defense System-of-Systems of the US Army and Its Inspiration [J]. Modern Defense Technology, 2020, 48(6): 26-38. |
| Viewed | ||||||
|
Full text |
|
|||||
|
Abstract |
|
|||||